ScanCam Report
The ScanCam report displays laser pipe-profiling information for inspections containing supported Rausch ScanCam data.
ScanCam uses a spinning laser to measure the shape and ovality of a pipe. The report helps users review changes in horizontal deviation, vertical deviation, and pipe diameter throughout the inspection.
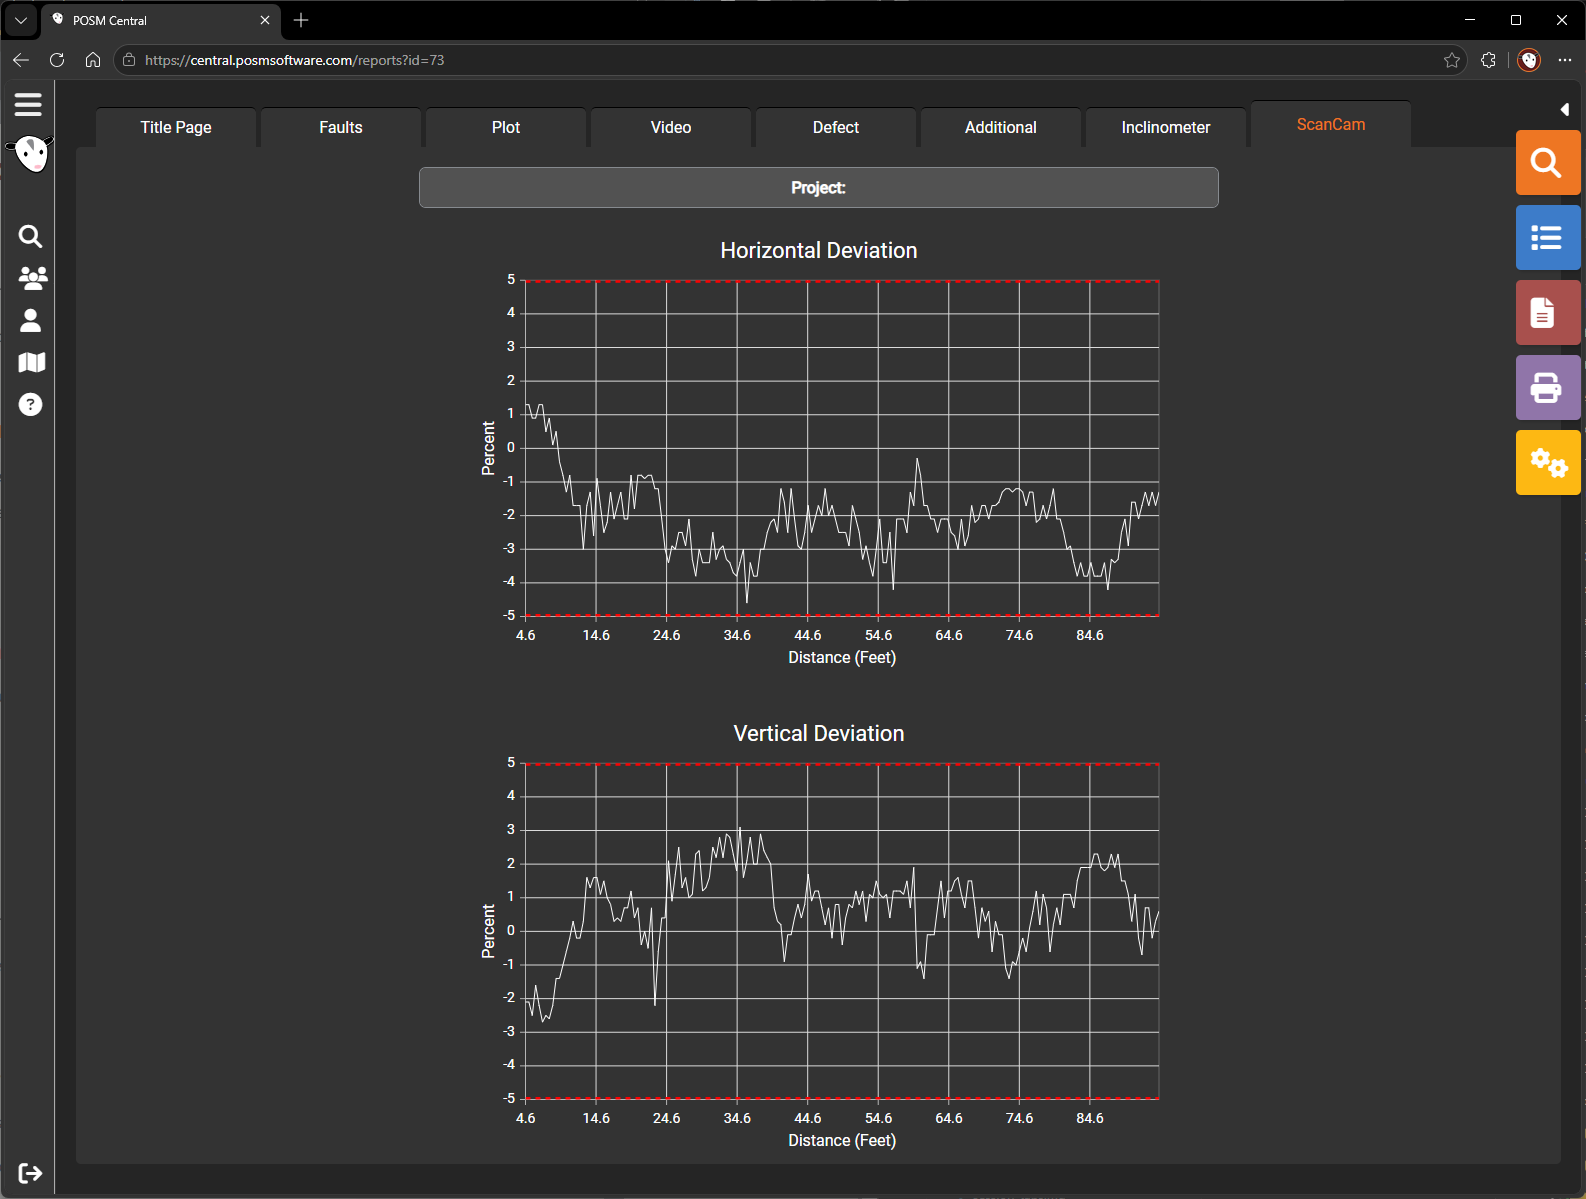
Open the ScanCam Report
- Open Session Management.
- Select an inspection containing ScanCam data.
- Select Open Reports.
- Select the ScanCam tab.
Information Shown
Depending on the recorded data and selected report settings, the ScanCam report may include:
- Horizontal deviation plot
- Vertical deviation plot
- Pipe diameter or pipe-size plot
- Inspection distance
- Average pipe diameter
- Maximum deviation information
- Percentage of the pipe exceeding selected deviation limits
- Rotation speed
- Points recorded per rotation
- Average travel speed
- Scan pitch
- Scan validity information
- Distance remarks
The exact information shown depends on the ScanCam data recorded during the inspection.
Understanding the ScanCam Plots
The ScanCam report can display multiple plots that describe the measured pipe shape.
Horizontal Deviation
The horizontal deviation plot shows how the measured pipe shape varies from side to side.
Vertical Deviation
The vertical deviation plot shows how the measured pipe shape varies vertically.
Pipe Diameter
The pipe-diameter plot shows changes in the measured pipe size along the inspection.
These plots can help identify:
- Pipe ovality
- Changes in pipe shape
- Areas with significant deformation
- Diameter changes
- Locations that may require closer review
ScanCam results should be reviewed together with the inspection video, observations, and other available reports.
Deviation Limits
The report may display limit bars representing selected deviation percentages.
Available options may include:
- No Limits
- 5 percent
- 7.5 percent
When a limit is selected, the report displays reference lines that help identify portions of the pipe exceeding the selected deviation.
Change ScanCam Report Settings
While viewing the ScanCam report, select the yellow Report Settings button on the left side of the screen.
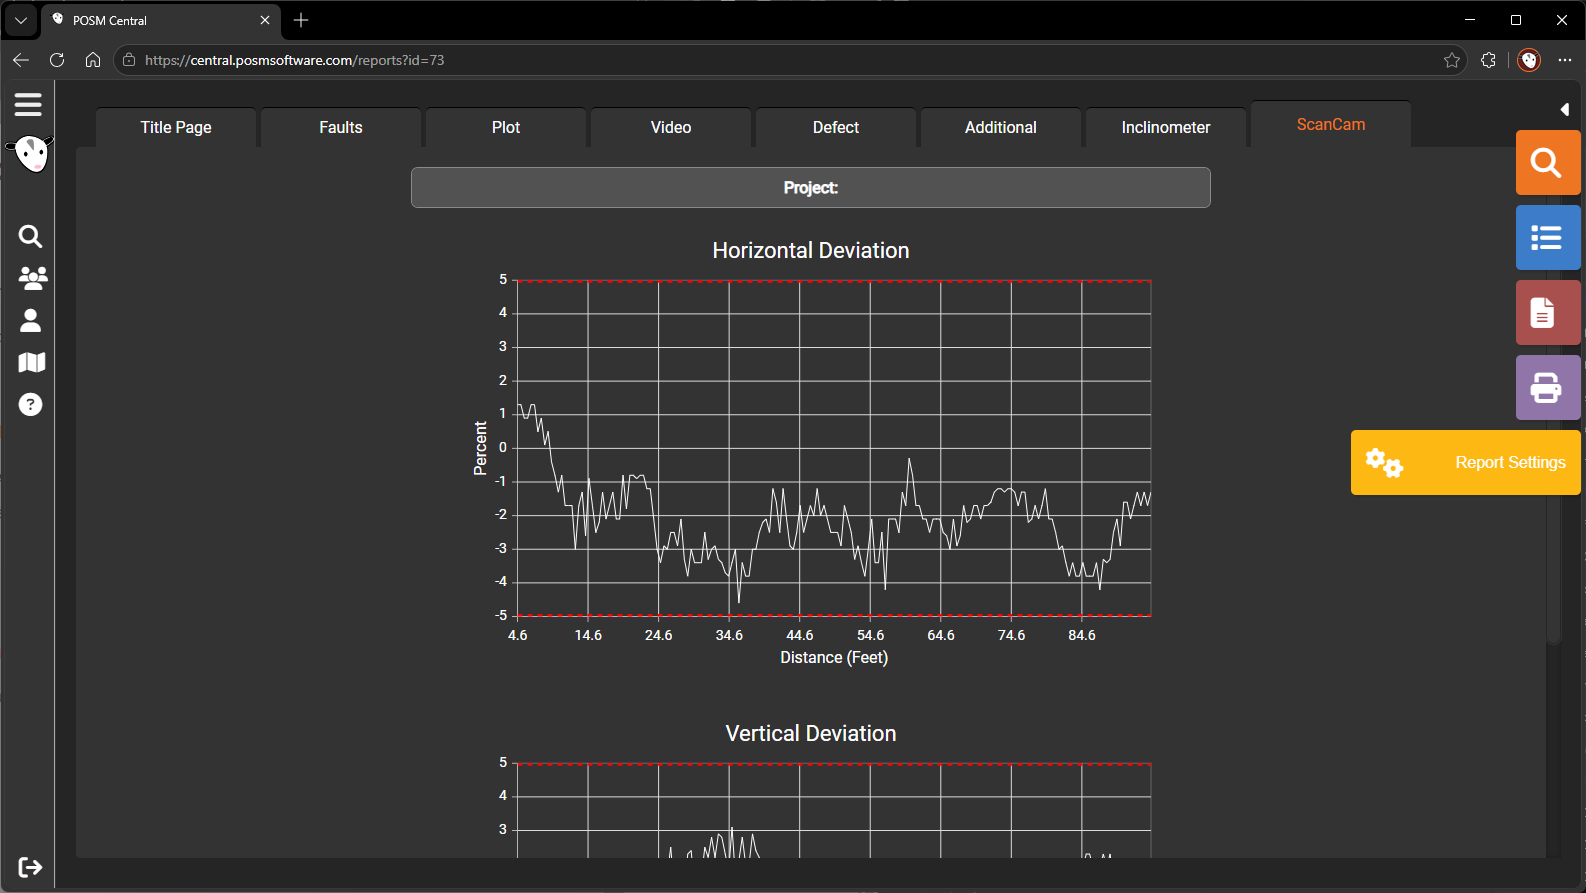
The Report Settings window contains display, filtering, plot, and save options for the ScanCam report.
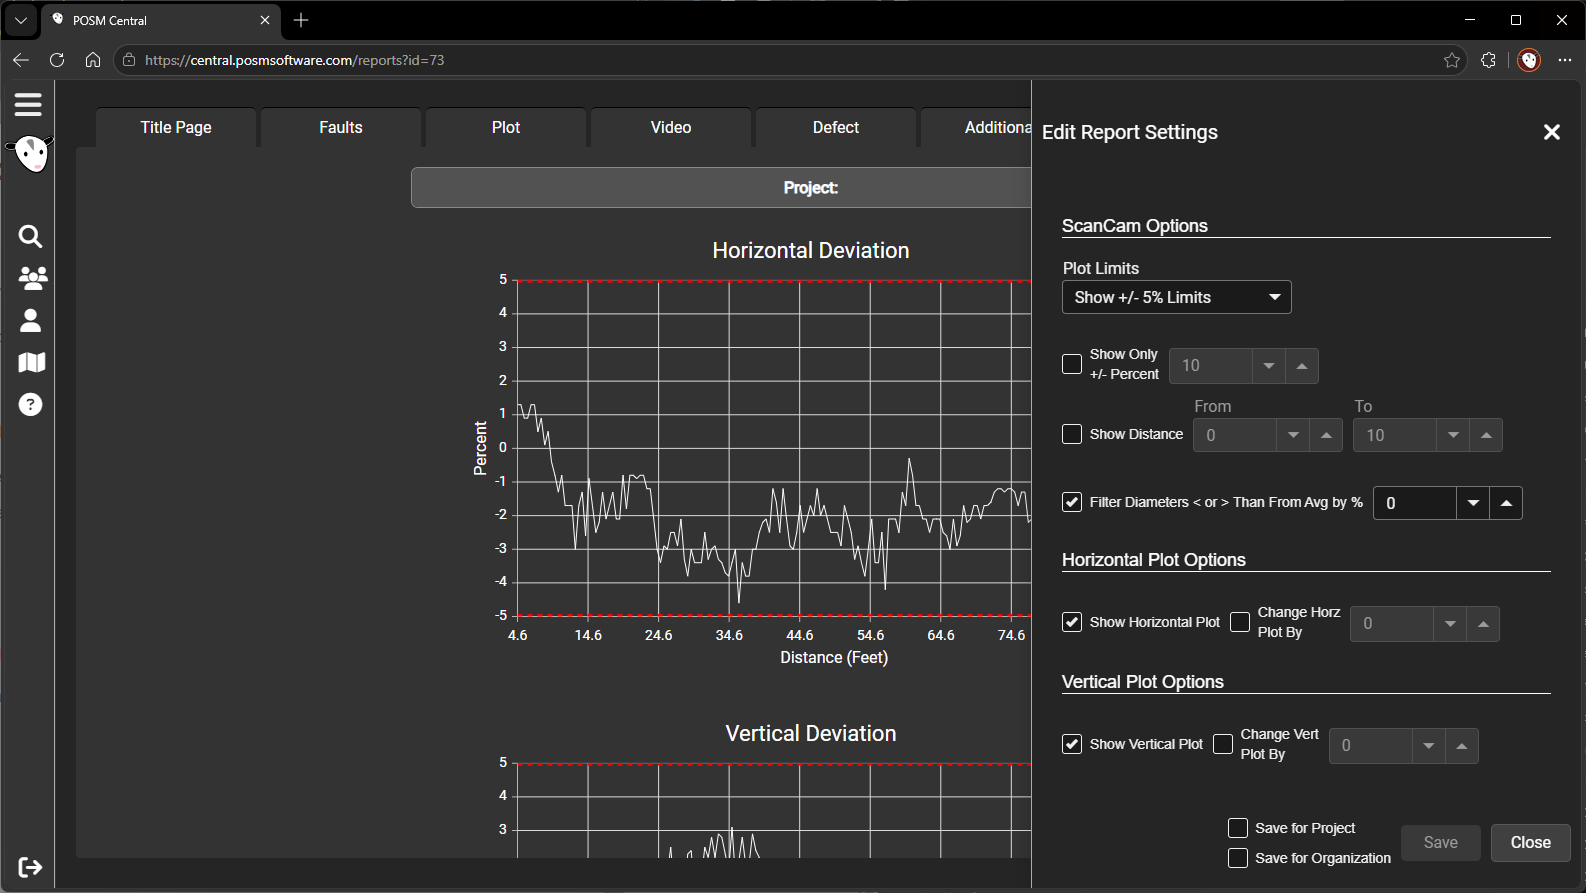
Show or Hide ScanCam Plots
Use the available options in the Report Settings window to control which plots appear.
Options may include:
- Show Horizontal Plot
- Show Vertical Plot
- Show Width Plot
Selecting a plot displays it in the report. Clearing the option removes that plot.
The Width Plot represents the pipe-size or diameter information recorded during the scan.
Select Deviation Limits
Use the report settings to select the deviation limits shown on the plots.
Depending on the available options, users may select:
- No limit bars
- 5 percent limit bars
- 7.5 percent limit bars
Use these reference lines to identify areas where the measured pipe shape exceeds the selected percentage.
Limit the Displayed Percentage Range
Use Show Only +/- Percent to limit the vertical range displayed on the deviation plots.
Enter the desired percentage in the adjoining field.
For example, entering 7 limits the plot to data between approximately positive 7 percent and negative 7 percent.
This can make smaller changes easier to review by preventing the chart from displaying a much larger range than necessary.
Maximum Data Value
Use Maximum Data Value to limit the largest deviation value displayed on the plots.
This can help remove unusually large spikes, such as data recorded after the camera has traveled beyond the end of the pipe.
Adjust Horizontal or Vertical Data
The Report Settings window may include:
- Change Horizontal Data By
- Change Vertical Data By
These settings adjust the plotted horizontal or vertical values.
Caution
These are advanced settings and should normally remain set to 0 unless there is a specific reason to adjust the data.
Filter Diameter Values
Use Filter Diameters Greater or Less Than From Average to limit unusually high or low diameter values displayed on the pipe-size plot.
This can help remove extreme readings that do not represent the inspected pipe, such as readings captured outside the pipe.
Group Diameter Values
Use Group Diameter Values in Increments of to average pipe-diameter measurements over a selected distance.
For example, grouping values by one foot or one meter can produce a smoother pipe-size plot.
A larger grouping value generally creates a smoother chart but shows less individual variation.
Auto Center Data
Select Auto Center Data to move the horizontal and vertical deviation values toward their average point.
Caution
Auto Center Data should generally be used only for special cases where the recorded ScanCam percentages need to be centered for proper review.
Save Report Settings
At the bottom of the same Report Settings window, near the Save and Cancel buttons, are two checkboxes that determine where the selected preferences are saved.
Save for Project
Select the Save for Project checkbox to apply the ScanCam report settings to the current project.
Use this option when a particular project requires different plots, limits, filtering, or display settings than the organization default.
Save for Organization
Select the Save for Organization checkbox to apply the selected ScanCam report settings as the organization-wide default.
Important
Selecting Save for Organization changes the default ScanCam report settings for the entire organization. Review the selected plots, limits, and filters before saving.
Save or Cancel
After selecting the report options:
- Select Save to apply and save the settings.
- Select Cancel to close the window without saving changes.
Project-level settings allow a particular project to use ScanCam report settings that differ from the organization default.
Report Availability
The ScanCam tab appears only when supported ScanCam data exists for the inspection.
A separate ScanCam import is not required.
The POSM Data Sync Tool imports the ScanCam information automatically with the rest of the session.
Missing ScanCam Report
If the ScanCam tab does not appear:
- Confirm that ScanCam data was recorded during the inspection.
- Confirm that the complete session was imported.
- Confirm that the import completed successfully.
- Review the Data Sync Tool status.
- Contact POSM Support if the data exists but the report remains unavailable.