Plot Report
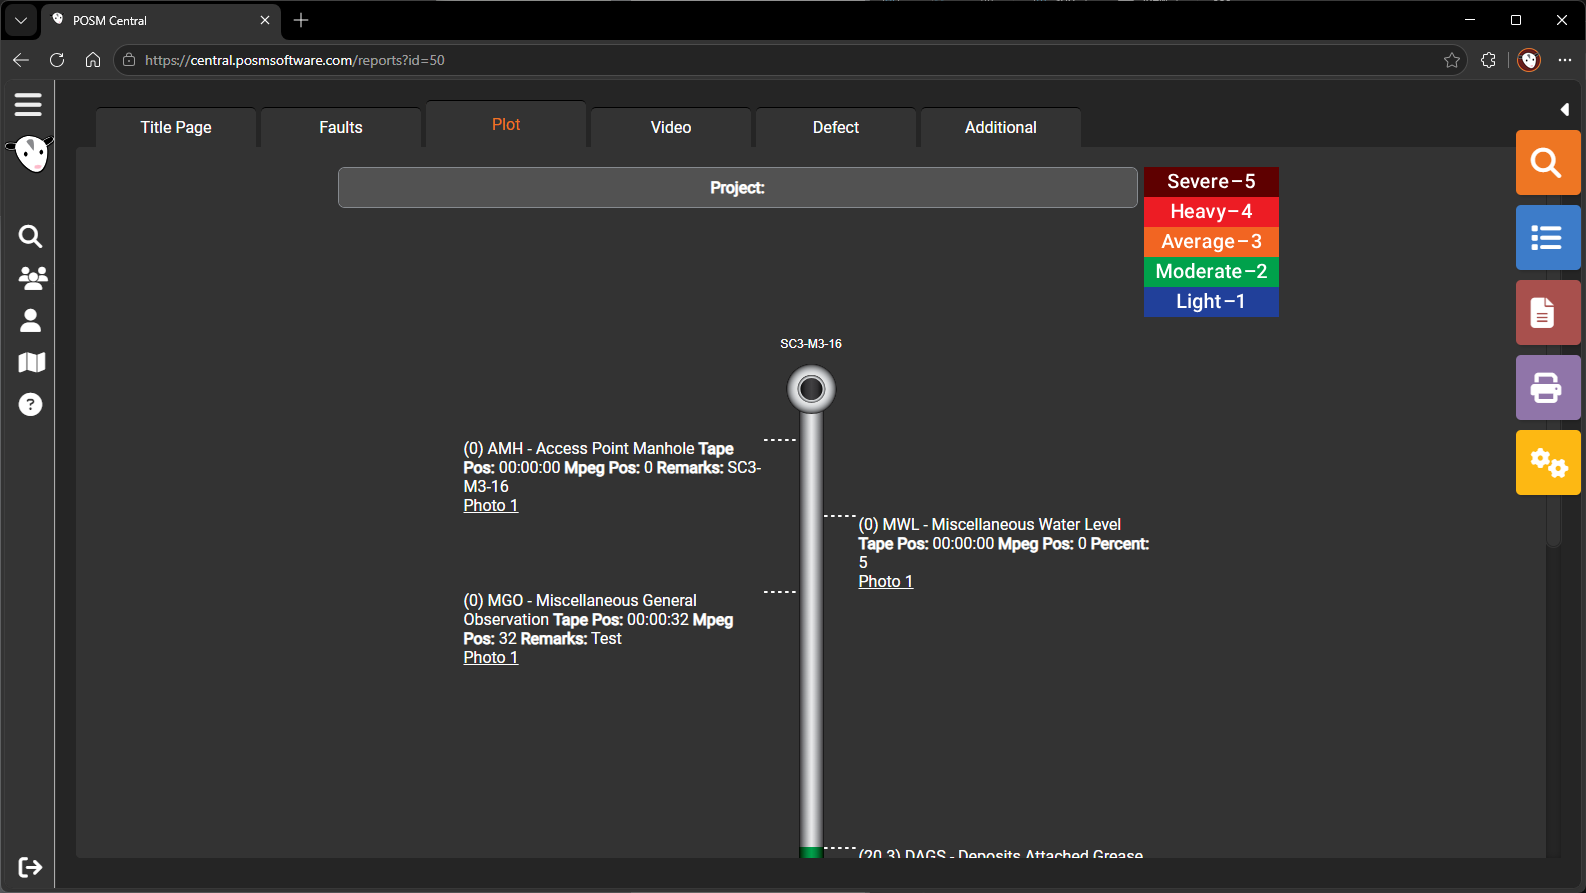
The Plot report displays a graphical representation of the pipe and the observations recorded along it.
This report is similar to the pipe plot shown on the right side of the Edit Observations screen.
Open the Plot Report
- Open Session Management.
- Select an inspection.
- Select Open Reports.
- Select the Plot tab.
What the Plot Shows
The Plot report may display:
- Pipe length
- Inspection direction
- Observation footage
- Observation locations
- Observation codes
- Video position
- Pipe segments
- Severity information
- Structural and maintenance information
- Flow direction
- Manhole information
- Observation images
The exact information shown depends on the inspection template, recorded observation data, and selected report settings.
NASSCO Severity Colors
When the inspection uses an applicable NASSCO template, sections of the pipe plot may be color-coded according to defect severity.
The color bar provides a visual indication of where more significant structural or maintenance defects were recorded.
Using the Plot
Use the Plot report to:
- Identify where observations occurred
- Compare defects along the length of the pipe
- Review clusters of observations
- Locate areas with higher severity
- Relate observation footage to pipe position
- Compare video time with inspection distance
- Review structural and maintenance conditions
Change Plot Report Settings
While viewing the Plot report, select the yellow Report Settings button on the left side of the screen.
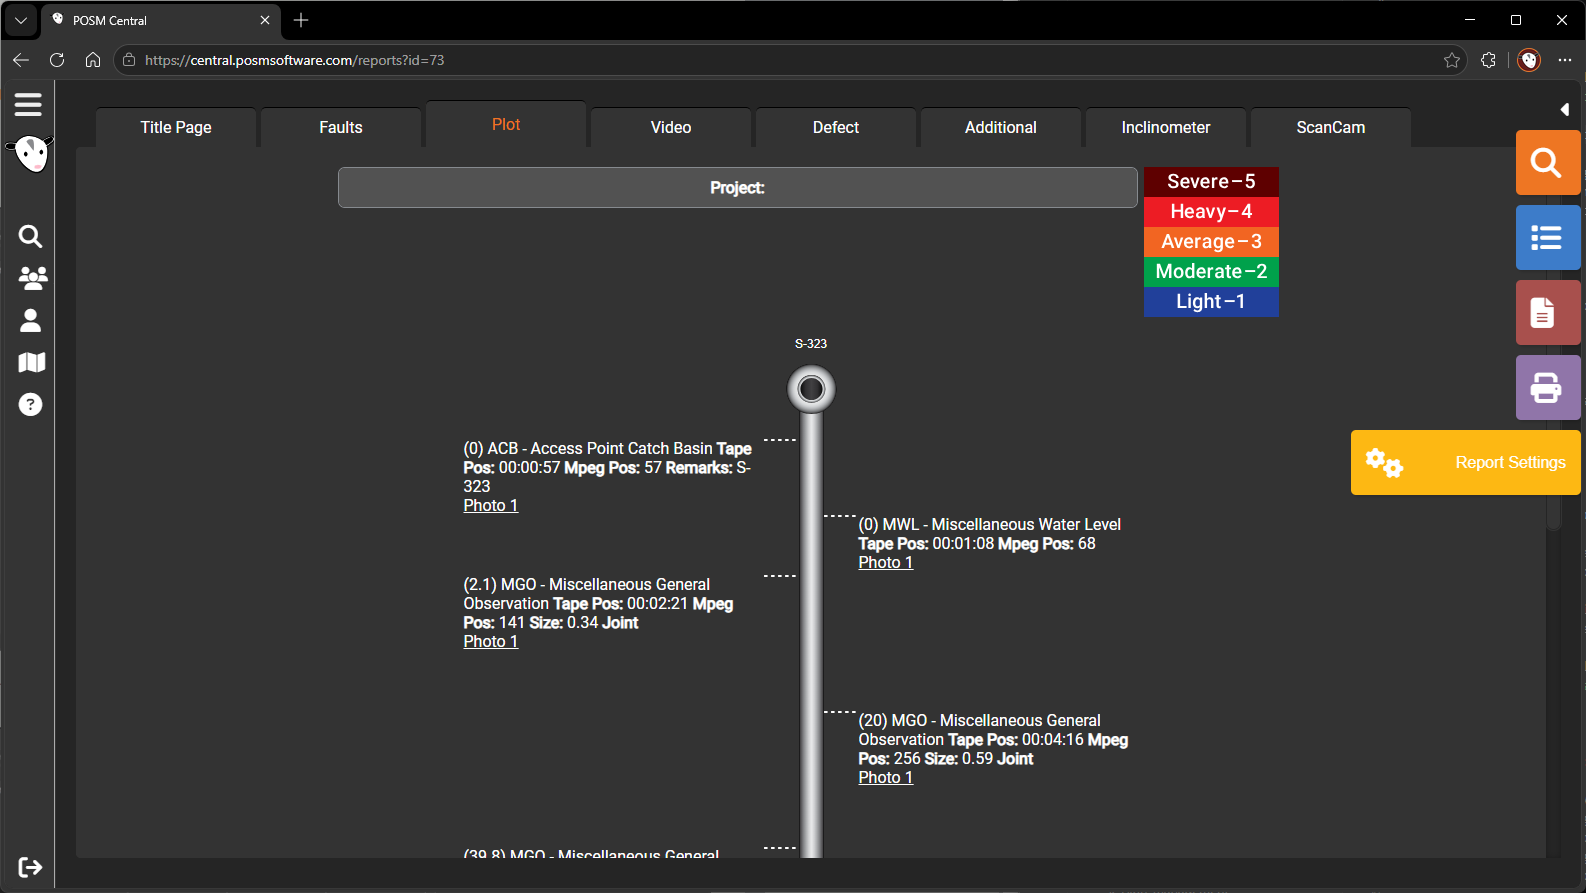
The Report Settings window allows authorized users to control which information, pictures, labels, and layout options appear in the Plot report.
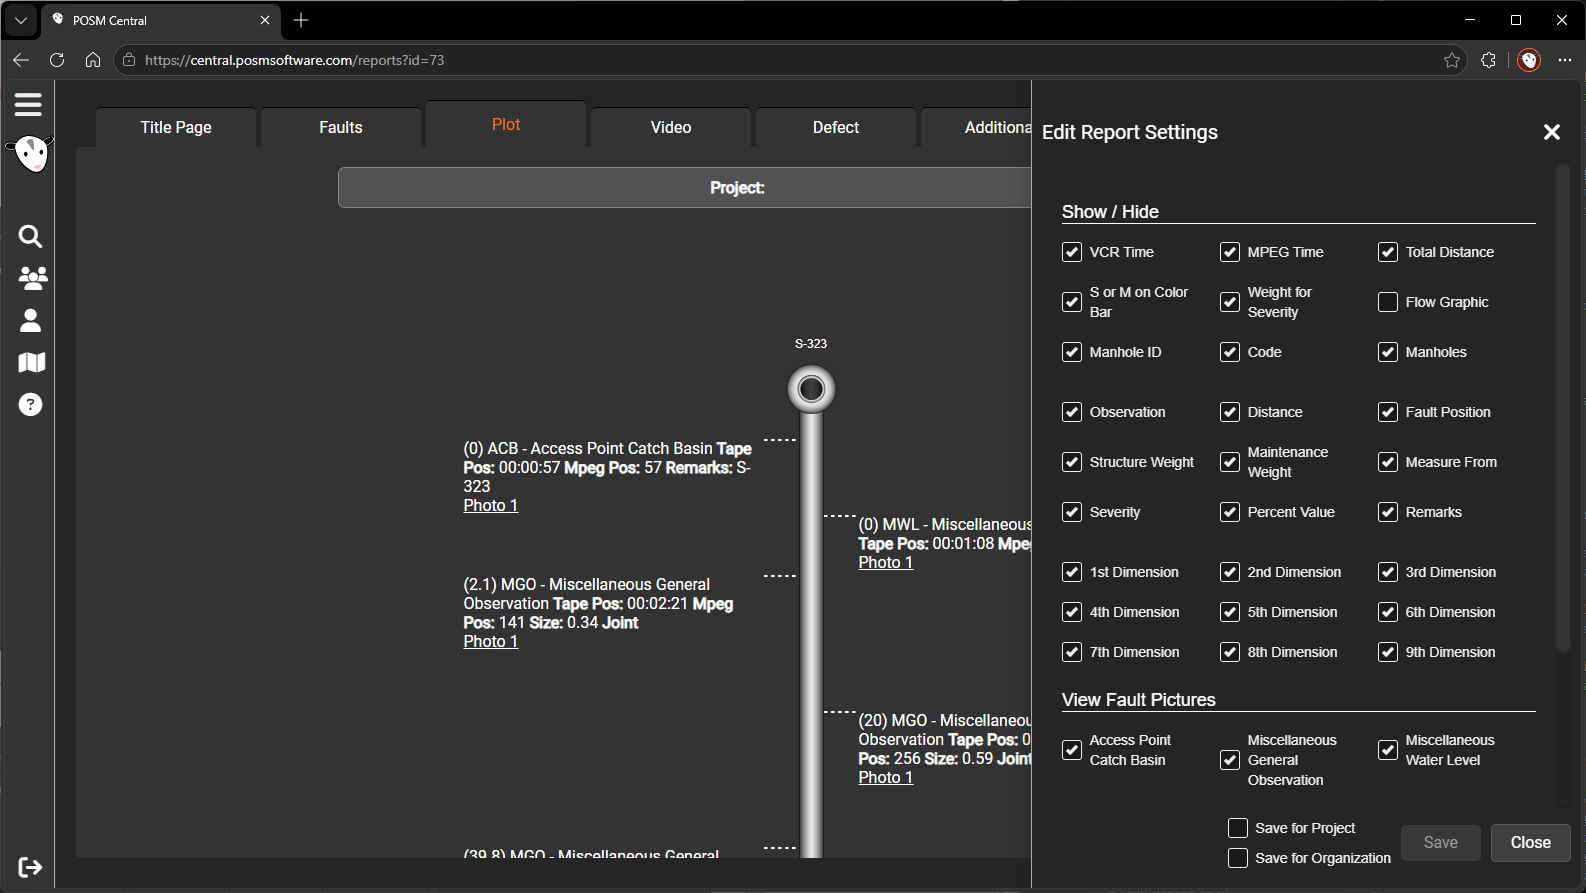
Show or Hide Plot Information
Use the checkboxes in the Report Settings window to show or hide the following information:
- VCR Time
- MPEG Time
- Total Distance
- S or M on Color Bar
- Weight for Severity
- Flow Graphic
- Manhole ID
- Code
- Manholes
- Observation
- Distance
- Fault Position
- Structural Weight
- Maintenance Weight
- Measure From
- Severity
- Percent Value
- Remarks
- Custom Field 1
- Custom Field 2
- Custom Field 3
- Custom Field 4
- Custom Field 5
- Custom Field 6
- Custom Field 7
- Custom Field 8
- Custom Field 9
Selecting an option displays it in the report. Clearing an option removes it.
Show or Hide Selected Observation Pictures
The Report Settings window also allows users to control whether pictures are displayed for certain observation types.
Picture display can be turned on or off for:
- Access Point Catch Basin
- Miscellaneous General Observation
- Miscellaneous Water Level
Use these options to include or remove selected observation images from the Plot report.
Other Plot Actions
The Report Settings window includes additional options that change how the plot is arranged.
Reverse Flow Direction Graph
Select Reverse Flow Direction Graph to reverse the direction in which the pipe and observations are displayed.
Use this option when the default graph direction does not match the preferred inspection or flow orientation.
Sort by Time
Select Sort by Time to organize report information according to when observations occurred in the inspection video.
When this option is not selected, the report may use its normal distance- or observation-based order.
Mirror Plot Report
Select Mirror Plot Report to reverse the visual orientation of the plot.
This can be useful when the report needs to match a different viewing direction or page layout.
Customize Top and Bottom ID Text
The Report Settings window includes fields for entering custom identification text at the top and bottom of the Plot report.
Top ID Text
Enter custom text in the Top ID Text field to change or supplement the identification shown at the top of the plot.
Bottom ID Text
Enter custom text in the Bottom ID Text field to change or supplement the identification shown at the bottom of the plot.
These fields can be used when a project or customer requires specific labels on the report.
Save Report Settings
At the bottom of the same Report Settings window, near the Save and Cancel buttons, are two checkboxes that determine where the selected preferences are saved.
Save for Project
Select the Save for Project checkbox to apply the Plot report settings to the current project.
Use this option when a particular project requires different fields, picture settings, labels, or plot orientation than the organization default.
Save for Organization
Select the Save for Organization checkbox to apply the selected Plot report settings as the organization-wide default.
Important
Selecting Save for Organization changes the default Plot report settings for the entire organization. Review the selected fields, picture options, custom text, and layout settings before saving.
Save or Cancel
After selecting the report options:
- Select Save to apply and save the settings.
- Select Cancel to close the window without saving changes.
Project-level settings allow a particular project to use a Plot report layout that differs from the organization default.
Incorrect Observation Locations
If an observation appears in the wrong position, review the observation in Edit Observations.
Confirm that the correct footage, distance, video time, and observation position are recorded.
Learn how to edit observations