Inclination Report
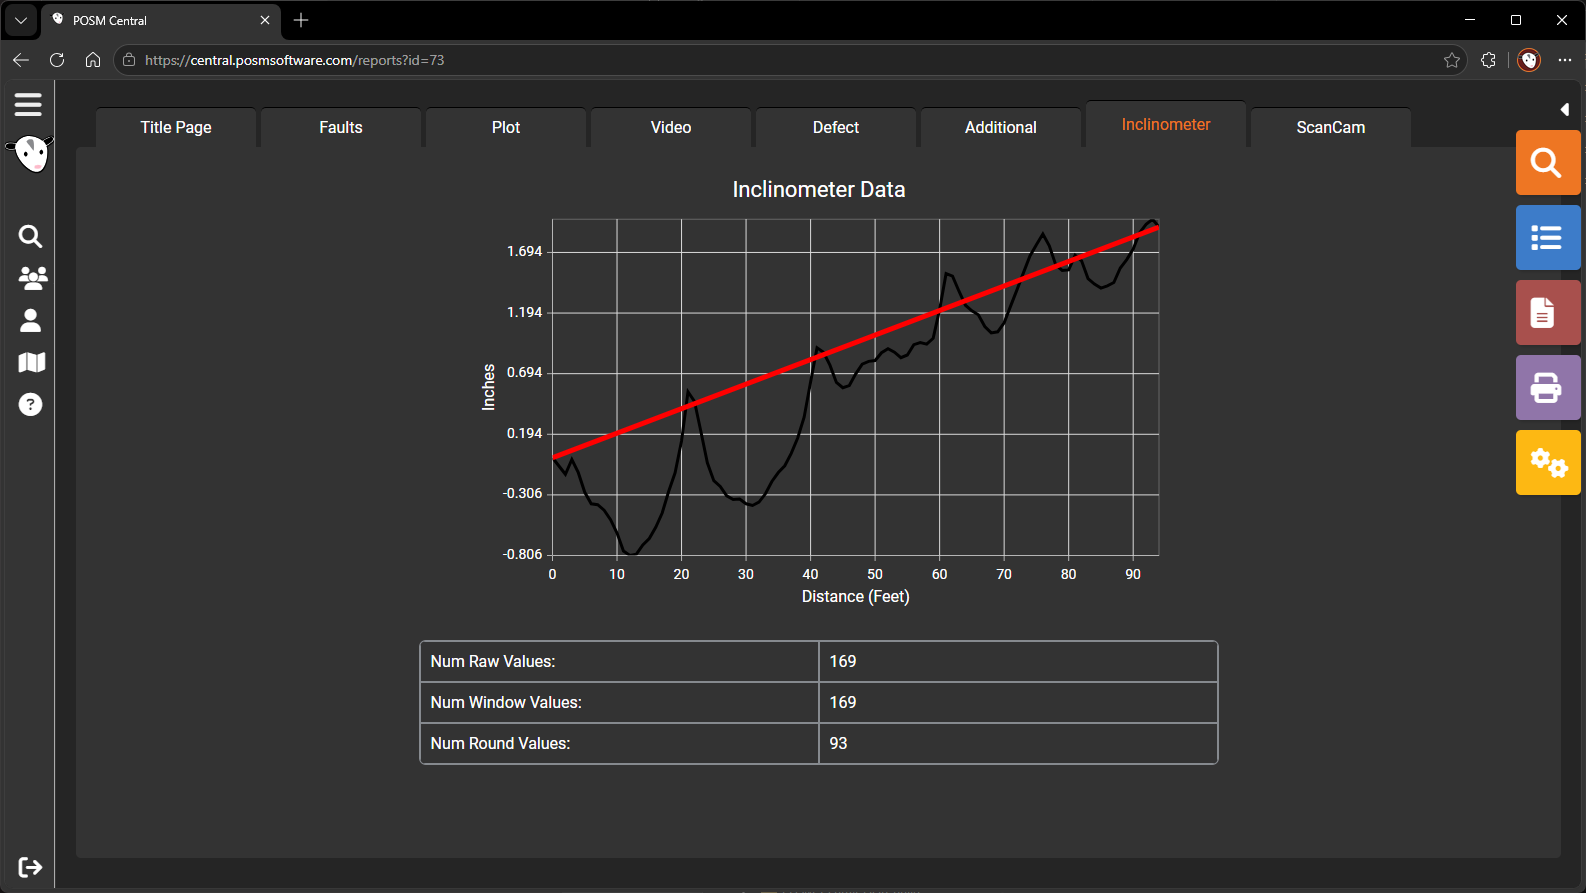
The Inclination report shows changes in the camera’s vertical movement as it travels through the pipe.
Inclination data can help identify changes in pipe grade and possible sag areas.
Open the Inclination Report
- Open Session Management.
- Select an inspection containing inclination data.
- Select Open Reports.
- Select the Inclination tab.
Information Shown
The Inclination report may include:
- Inspection footage
- Camera inclination
- Upward movement
- Downward movement
- Changes in pipe grade
- Possible sag locations
- A chart showing inclination through the length of the inspection
Understanding the Chart
The chart represents how the inspection camera moved vertically while traveling through the pipe.
Changes in the chart may indicate:
- A rising section of pipe
- A falling section of pipe
- A change in grade
- A possible low area or sag
- Other changes in the pipe profile
Inclination information should be reviewed together with inspection observations, video, and other available data.
Change Inclination Report Settings
While viewing the Inclination report, select the yellow Report Settings button on the left side of the screen.
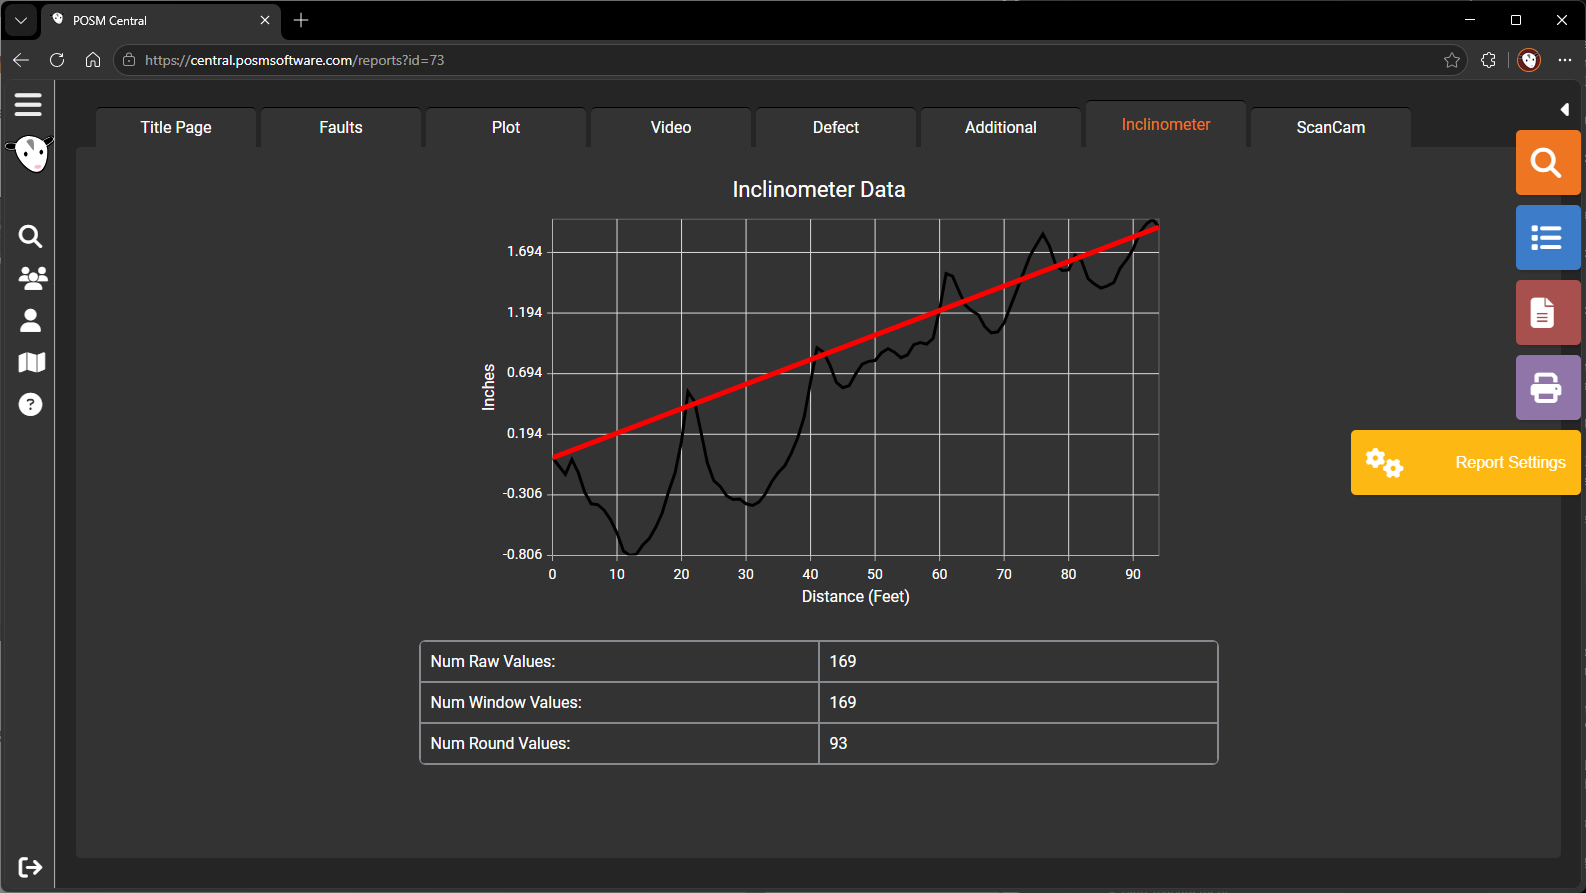
The Report Settings window contains display, filtering, and save options for the inclination chart.
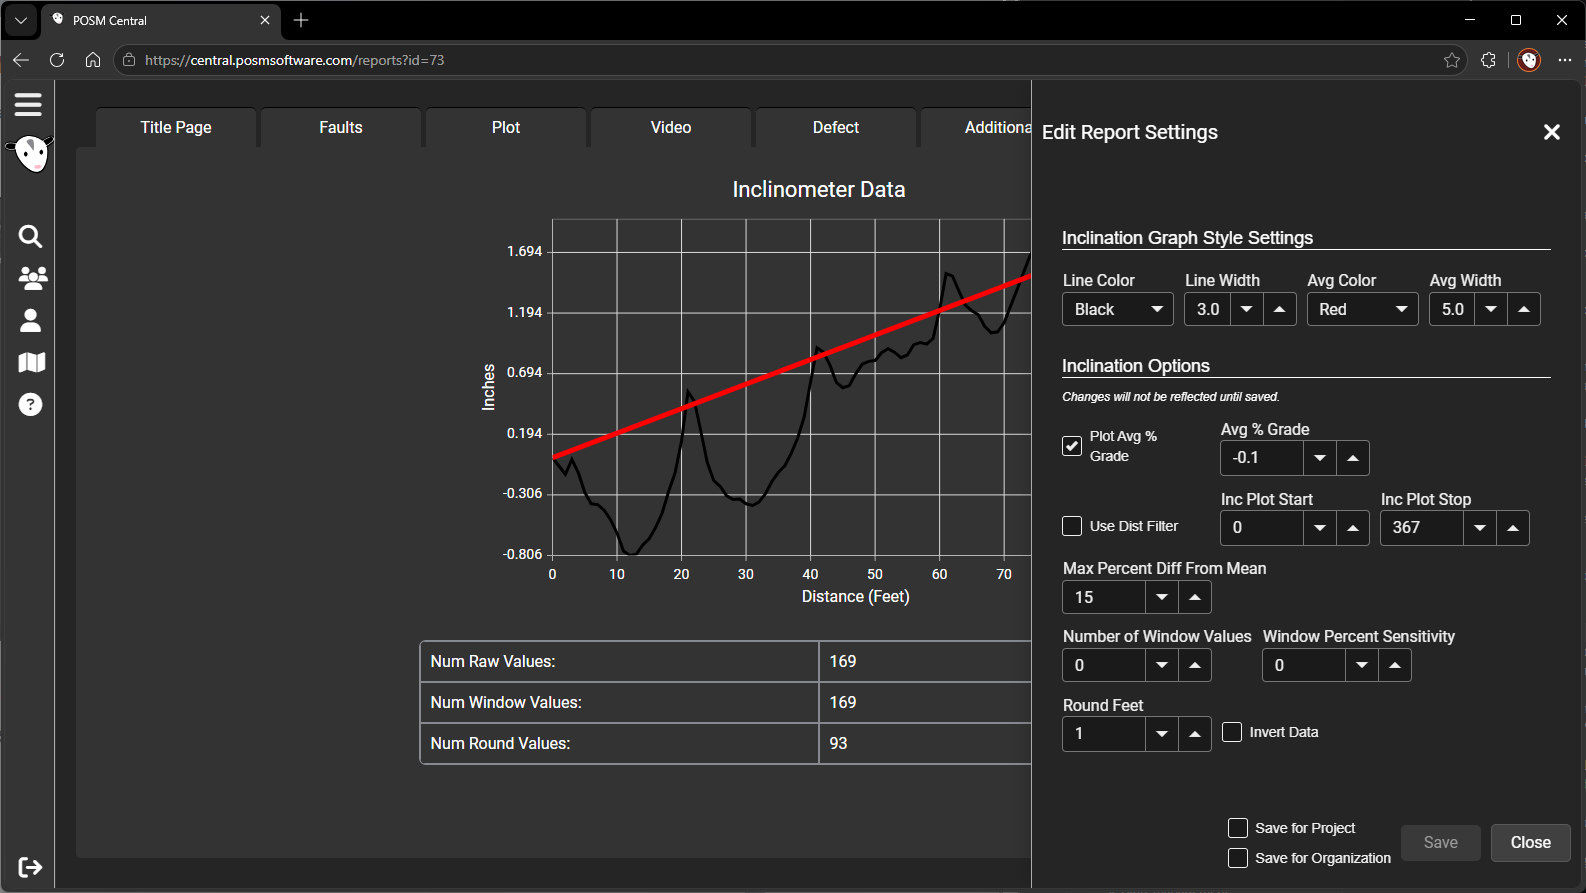
Chart Display Settings
The available settings include:
- Inclination line color — changes the color of the plotted inclination line.
- Average inclination line color — changes the color of the average inclination line.
- Line width — changes the thickness of the plotted lines.
- Sensitivity filter — adjusts how much the inclination data is smoothed.
Sensitivity and Graph Smoothing
The sensitivity setting filters small changes in the recorded inclination data.
Increasing the filtering can smooth the chart and reduce minor fluctuations. Reducing the filtering displays more of the original variation in the recorded data.
Tip
The settings shown in the example screenshot are close to the default settings used in the standard POSM inspection application.
Save Report Settings
At the bottom of the same Report Settings window, near the Save and Cancel buttons, are two checkboxes that determine where the selected preferences are saved.
Save for Project
Select the Save for Project checkbox to apply the inclination report settings to the current project.
Use this option when a particular project requires chart colors, line widths, or sensitivity settings that differ from the organization default.
Save for Organization
Select the Save for Organization checkbox to apply the selected inclination report settings as the organization-wide default.
Important
Selecting Save for Organization changes the default Inclination report settings for the entire organization. Review the chart colors, line width, and sensitivity before saving.
Save or Cancel
After selecting the report options:
- Select Save to apply and save the settings.
- Select Cancel to close the window without saving changes.
Project-level settings allow a particular project to use Inclination report settings that differ from the organization default.
Report Availability
The Inclination tab appears only when inclination data exists for the inspection.
A separate inclination import is not required.
The POSM Data Sync Tool imports the inclination data automatically with the session.
Missing Inclination Report
If the Inclination tab does not appear:
- Confirm that inclination data was recorded.
- Confirm that the complete session was imported.
- Check the Data Sync Tool status.
- Contact POSM Support if the data exists but the report is unavailable.